Next: The Local Cache Up: Reports Previous: Get more reports Contents Index
Custom graphs work just like the custom reports. The difference is that instead of generating HTML, you just put the word ``GRAPH'' (without the speechmarks) in the HTML box to indicate you want ASM to draw a graph instead. All the SQL keys, including $ASK and $VAR are still supported in the normal way.
ASM will dissect the results of the query in the following way to generate a graph:
YEAR(DateReceived) AS Year,
SUM(ownerdonation.Donation) AS TotalAmount
FROM ownerdonation
WHERE MovementID > 0
GROUP BY YEAR(DateReceived)
ORDER BY Year
| Year | TotalAmount
2004 |
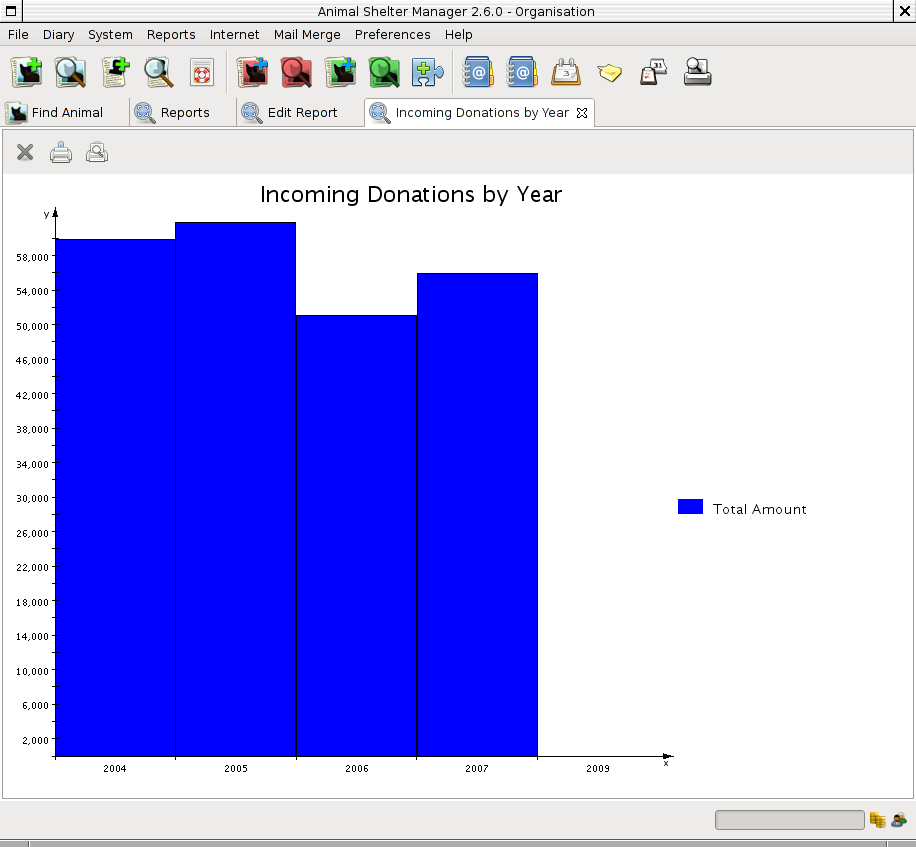
Note that the graphs use a relative scale, interpreted from the data. If all of your column data is the same value, then the graph will not display because it has no variance.
http://sheltermanager.sf.net